{{#if (not signed_in)}} {{#is help_center.name "Ideagen Help"}} {{#link "sign_in" class="unified-navigation--btn-primary"}}Sign in{{/link}} {{else}} {{#link "sign_in" class="unified-navigation--btn-primary"}}Sign in{{/link}}
{{/is}} {{/if}} {{#if signed_in}}
 {{#is help_center.name "Ideagen Help"}}
Manage tickets
{{else}} {{#link "requests" role="menuitem"}}
Manage tickets {{/link}} {{/is}}
Update profile
Change password
Privacy Policy
Terms of Use
{{#link "sign_out" role="menuitem" class="signOut"}}
Sign out {{/link}}
{{/if}}
{{#is help_center.name "Ideagen Help"}}
Manage tickets
{{else}} {{#link "requests" role="menuitem"}}
Manage tickets {{/link}} {{/is}}
Update profile
Change password
Privacy Policy
Terms of Use
{{#link "sign_out" role="menuitem" class="signOut"}}
Sign out {{/link}}
{{/if}}
{{user.name}}
Looking for help?
Common queries
Send us feedback

Before you start
This form is for Ideagen Luminate feedback only. Your submission will not receive a response.
Looking for support? Select the solution you need help with and open a ticket with us.
We'd love to hear your thoughts on features, usability, or what you love about Ideagen Luminate.

Question
Dashboards
 +1
+1I have attempted to set up a dashboard to monitor incidents and occurrences. This is what I have so far…
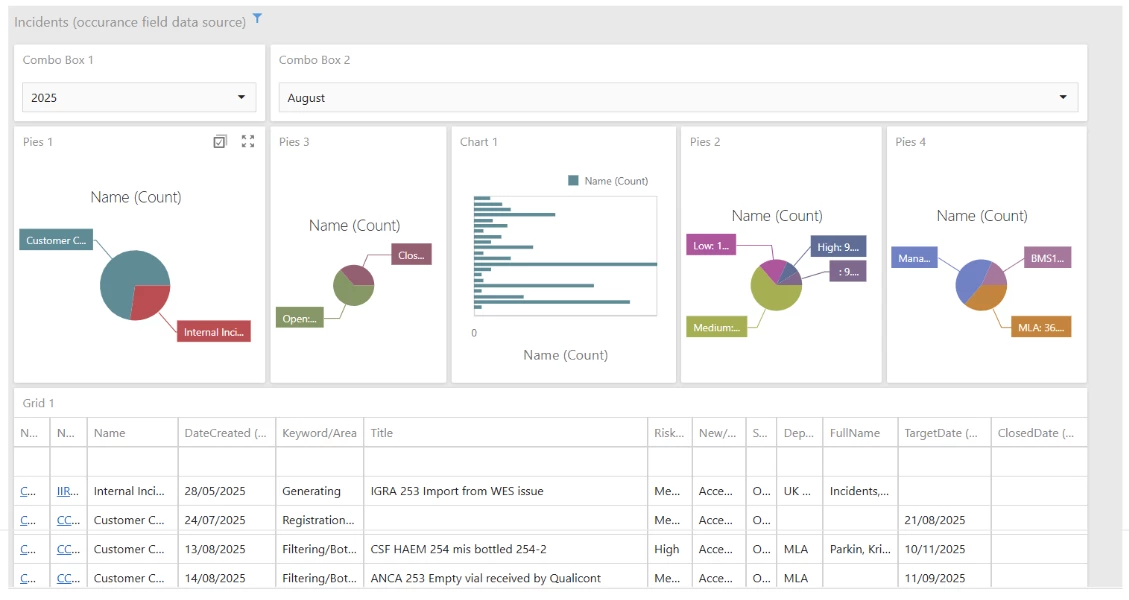
The issue that I have is with the combo boxes and the subsequent data displayed. Here, the combo boxes are set to show August 2025 records, the pie charts all show the correct number of records (9), chart 1 and grid 1 do not (you can see here that the grid shows records from May and July).
The combo boxes have 'incident' as a data source as do the pie charts. Chart 1 and Grid 1 have 'occurrences' as a data source we have to set the grid up on the occurrences data source to access all of the required fields.
If I amend the data source for the combo boxes to 'occurrences' then all of the subsequent plots show incorrect amounts of data.
Additionally, the hyperlinks that we were provided do not work
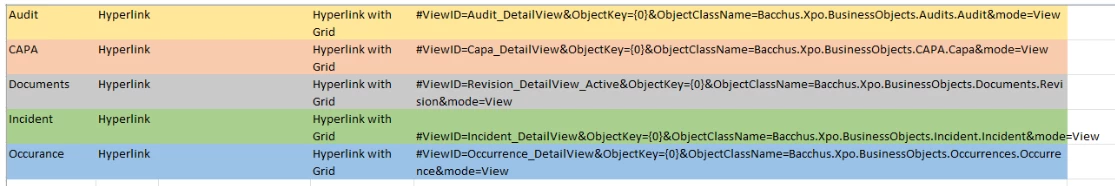
I have tried the incident and the occurrence hyperlink in all possible combinations and it results in the following error message

I would appreciate your input as we have been struggling along with this for weeks.
Thanks Matt


Coming from Skills? Create an Ideagen Luminate account to link your learner profile. Learn more.
Coming from Skills? Create an Ideagen Luminate account to link your learner profile. Learn more.
Coming from Skills? Create an Ideagen Luminate account to link your learner profile. Learn more.
Coming from Skills? Create an Ideagen Luminate account to link your learner profile. Learn more.
Login with SSO
Ideagen Employee Login Login with Ideagen Hubor
Enter your E-mail address. We'll send you an e-mail with instructions to reset your password.